Property Portfolio Plan: How $200,000 Becomes Five Properties in Eight Years
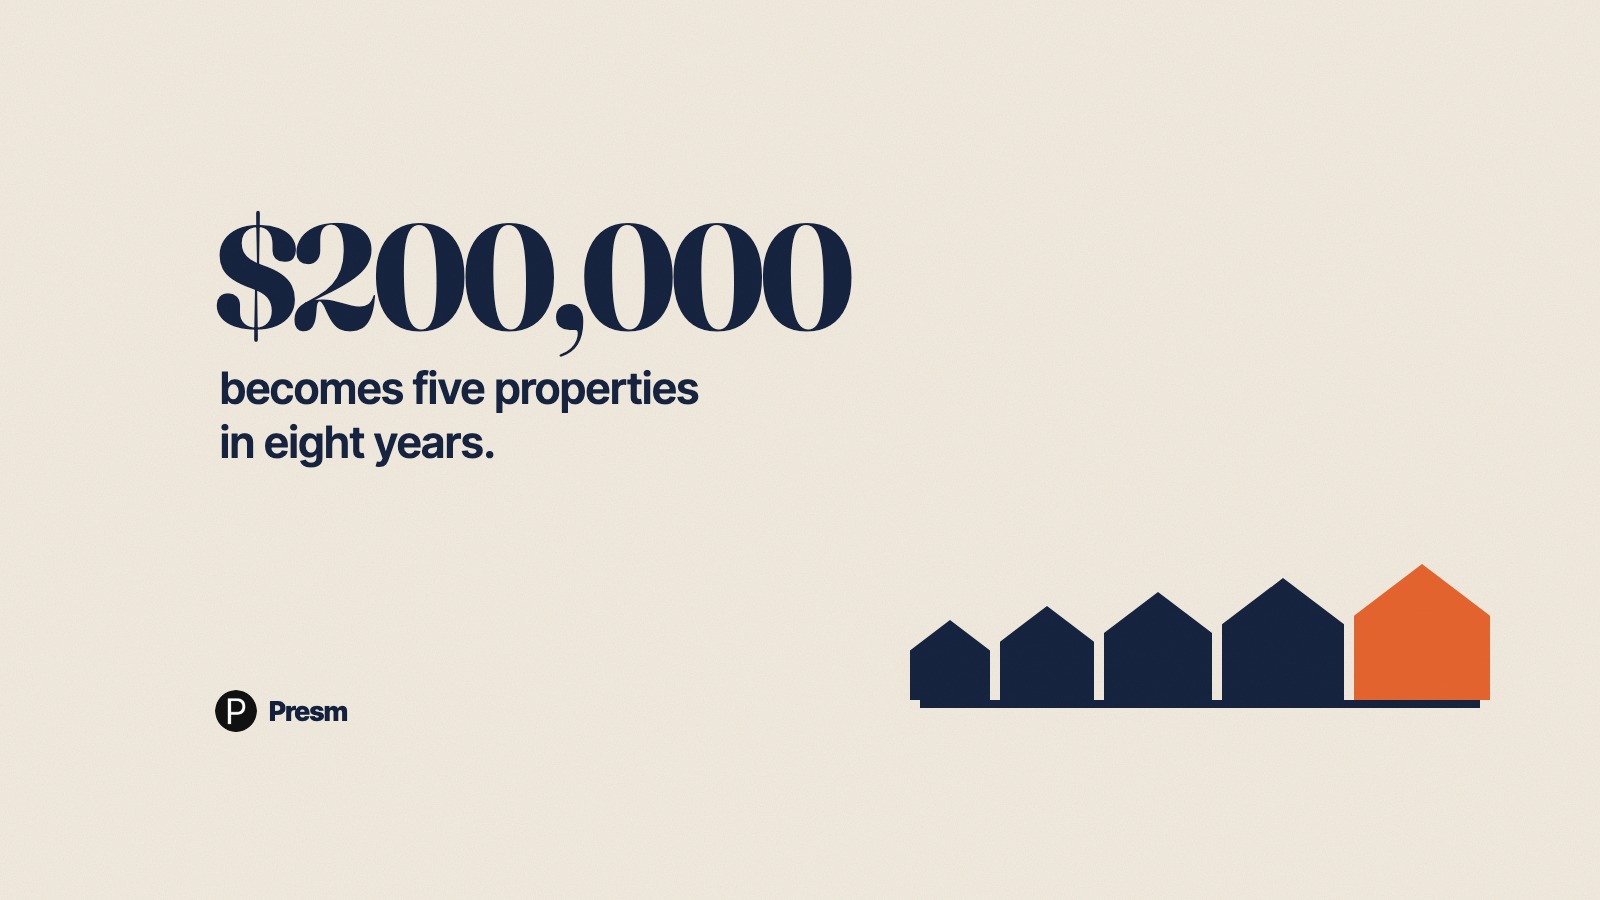
Most investors stop at one property. Some make it to two. The few who get to five or more do not have a different income — they have a different sequence. The order of the purchases, the structure each one is held in, the state each one sits in, and the equity-recycling cadence between them are what separate a single-property hobby from a portfolio that scales.
This post lays out the sequence that gets a $200,000 starting deposit to a five-property position in roughly eight years, with worked numbers and the points where most plans break down.
The Compounding Engine
The mechanism behind every multi-property portfolio is the same. Buy a property. Wait for value growth. Refinance to extract equity created by growth. Use that equity as the next deposit. Repeat.
Each round depends on three variables:
- Growth rate of the existing properties (drives equity creation)
- Serviceability headroom (drives whether the next loan gets approved)
- Cash flow position (drives whether you can afford the negative gearing on the next purchase while still living)
If any of those three breaks, the engine stops. If all three are running, the portfolio compounds.
Year 0: First Property — Geebung (4034)
Starting deposit: $200,000 cash. Strategy: capital growth focus, choose a state with strong fundamentals.
Target: $850,000 house in Geebung — middle-ring Brisbane, infrastructure ahead, gentrifying postcode.
| Acquisition cost element | Amount |
|---|---|
| Purchase price | $850,000 |
| Stamp duty (QLD) | $25,575 |
| Legal and inspections | $2,500 |
| Loan establishment | $700 |
| LMI (88% LVR, $748,000 loan) | $14,000 (capitalised) |
| Cash deployed | $128,775 |
| Cash buffer remaining | $71,225 |
| Loan balance after settlement | $762,000 |
Net cash position: $200,000 starting − $128,775 deployed = $71,225 remaining cash buffer. Critical. Investors who deploy 100% of capital have no buffer for the inevitable surprise.
Year 2-3: First Refinance and Second Purchase — Davoren Park (5113)
The Geebung property has grown at 5.5% per annum. New value at year 3: $1,005,500. Loan balance: $746,000 (slight paydown). New 80% LVR ceiling: $804,400. Useable equity: $58,400.
This is the deposit for the second property — augmented by $40,000 saved from salary over 3 years.
Target: $620,000 house in Davoren Park — outer Adelaide, value play with infrastructure. Different state, different land tax bucket, different rental cycle.
| Year-3 second acquisition | Amount |
|---|---|
| Purchase price | $620,000 |
| Stamp duty (SA) | $26,830 |
| Legal and inspections | $2,500 |
| LMI (88% LVR, $545,600 loan) | $11,500 (capitalised) |
| Cash deployed (refinance + savings) | $98,400 |
The investor now holds two properties, in two states, with a combined value of $1,625,500 and combined debt of $1,303,000.
Year 5: Refinance Both, Third Purchase — Cranbourne East (3977)
Both properties have grown another 5.5% × 2 years = 11.3%. Combined value rises to roughly $1,810,000. Debt has paid down marginally to $1,288,000. New 80% LVR ceiling: $1,448,000. Useable equity: $160,000.
Target: $740,000 house in Cranbourne East — outer Melbourne, growth corridor, transport infrastructure planned.
| Year-5 third acquisition | Amount |
|---|---|
| Purchase price | $740,000 |
| Stamp duty (VIC) | $39,070 |
| Legal and inspections | $2,500 |
| LMI (88% LVR, $651,200 loan) | $14,000 (capitalised) |
| Cash deployed | $124,375 |
Three properties, three states. Combined value $2,550,000. Combined debt $1,940,000. Equity: $610,000.
Year 7: Fourth Purchase — Tamworth (2340) Cash-Flow Anchor
Growth on the existing three at 5% per annum compounds the equity. By year 7, combined value is approximately $2,830,000. Useable equity at 80% LVR refinance: $190,000.
Target: $580,000 unit in Tamworth — regional NSW, cash flow positive at acquisition. The portfolio's first cash-flow purchase to support serviceability for further scaling.
Combined debt approaches $2.4M. Without a cash-flow positive position, the next loan does not get approved. The Tamworth property generates $33,800 of rent against $35,960 of expenses including 6.20% IO interest — close to neutral pre-tax, positive after depreciation and tax refund.
This is the critical move at the serviceability wall.
Year 8: Fifth Purchase — Logan Reserve (4133) Manufactured Equity
By year 8 the existing four properties have grown enough equity that another deposit is available. The investor has demonstrated serviceability through a cash-flow positive property. Lender appetite returns.
Target: a manufactured-equity play. $480,000 fixer-upper in Logan Reserve, $35,000 renovation budget, expected revaluation to $580,000. The fifth property is bought to create equity, not to wait for growth.
Year 8 Portfolio Snapshot
| Property | State | Value | Loan | Equity |
|---|---|---|---|---|
| Geebung (4034) | QLD | $1,200,000 | $740,000 | $460,000 |
| Davoren Park (5113) | SA | $830,000 | $560,000 | $270,000 |
| Cranbourne East (3977) | VIC | $920,000 | $645,000 | $275,000 |
| Tamworth (2340) | NSW | $620,000 | $464,000 | $156,000 |
| Logan Reserve (4133) renovated | QLD | $580,000 | $464,000 | $116,000 |
| Totals | $4,150,000 | $2,873,000 | $1,277,000 |
- Geebung (4034)
- QLD
- Davoren Park (5113)
- SA
- Cranbourne East (3977)
- VIC
- Tamworth (2340)
- NSW
- Logan Reserve (4133) renovated
- QLD
- Totals
- —
- Geebung (4034)
- $1,200,000
- Davoren Park (5113)
- $830,000
- Cranbourne East (3977)
- $920,000
- Tamworth (2340)
- $620,000
- Logan Reserve (4133) renovated
- $580,000
- Totals
- $4,150,000
- Geebung (4034)
- $740,000
- Davoren Park (5113)
- $560,000
- Cranbourne East (3977)
- $645,000
- Tamworth (2340)
- $464,000
- Logan Reserve (4133) renovated
- $464,000
- Totals
- $2,873,000
- Geebung (4034)
- $460,000
- Davoren Park (5113)
- $270,000
- Cranbourne East (3977)
- $275,000
- Tamworth (2340)
- $156,000
- Logan Reserve (4133) renovated
- $116,000
- Totals
- $1,277,000
The portfolio's net wealth created over 8 years: $1,277,000 less original $200,000 cash deployed less roughly $200,000 of cumulative after-tax holding cost = $877,000 of net wealth on $200,000 of initial capital.
That is a 4.4× multiplication of starting capital in 8 years.
Cash Flow Reality Check At Year 8
Annual cash position before tax (rough numbers, FY 2025-26):
| Property | Rent | Expenses | Cash before tax |
|---|---|---|---|
| Geebung | $39,000 | $54,000 | -$15,000 |
| Davoren Park | $30,000 | $38,000 | -$8,000 |
| Cranbourne East | $32,000 | $43,500 | -$11,500 |
| Tamworth | $33,800 | $35,960 | -$2,160 |
| Logan Reserve | $26,000 | $32,000 | -$6,000 |
| Total | $160,800 | $203,460 | -$42,660 |
- Geebung
- $39,000
- Davoren Park
- $30,000
- Cranbourne East
- $32,000
- Tamworth
- $33,800
- Logan Reserve
- $26,000
- Total
- $160,800
- Geebung
- $54,000
- Davoren Park
- $38,000
- Cranbourne East
- $43,500
- Tamworth
- $35,960
- Logan Reserve
- $32,000
- Total
- $203,460
- Geebung
- -$15,000
- Davoren Park
- -$8,000
- Cranbourne East
- -$11,500
- Tamworth
- -$2,160
- Logan Reserve
- -$6,000
- Total
- -$42,660
Plus depreciation across the five properties of approximately $40,000-$45,000.
After tax at a 32% blended rate: roughly $14,000 of refund, leaving net out-of-pocket cost of around $28,000 per year.
This is the cost of running a five-property portfolio that has not yet hit positive cash flow inflection. It is also the cost being paid against $1,277,000 of equity, growing at 5% per annum on $4,150,000 of asset base. That growth is approximately $207,500 per year — over seven times the holding cost.
Where This Plan Breaks
Break point 1: A single property that does not grow
If Geebung had flatlined at the original $850,000 for eight years, no equity would have been available for the second purchase, and the plan stops at one. State and suburb selection matters more than the acquisition specifics.
Break point 2: Serviceability cap
Each lender has limits. Most investors hit a serviceability wall around the third or fourth property if their income has not also grown. Adding a regional cash-flow property at the right point keeps the engine moving. Skipping that lever stalls the plan.
Break point 3: Stamp duty drag
Across five purchases, the stamp duty bill in this plan is approximately $130,000. None of it is deductible in year one. All of it has to come from working cash. Underestimating duty is the classic reason investors run out of money mid-plan.
Break point 4: Cash buffer erosion
Year 5 shows the buffer near zero. Without a cash reserve, a single tenant default, a rate rise, or an unexpected repair forces a property to be sold at the wrong time. Maintain at least 3 months of combined holding costs as cash buffer at all times — roughly $25,000-$30,000 at portfolio scale.
The Sequencing Lessons
Three principles drive the plan:
- Diversify by state from the second property onwards. Each state has its own land tax threshold, its own rental cycle, its own growth trajectory. Concentrating in one state caps both growth and tax efficiency.
- Mix growth and yield. All-growth portfolios run out of serviceability. All-yield portfolios run out of capital appreciation. Both are needed in proportion.
- Cash buffer is non-negotiable. Every transaction in this sequence depleted the buffer. Investors who run zero-buffer plans get forced sales when a single bad year hits.
Tools To Run Your Own Sequence
The Borrowing Power Calculator is the constraint check at every step. Before the next purchase, run it.
The Land Tax Calculator tells you what each candidate state will cost annually as your portfolio scales — the choice between Victoria and Queensland is worth $20,000+ per year by the third property.
For the early stages of this plan, see our first investment property beginners guide. For when serviceability becomes the binding constraint, see our scaling property portfolios guide.
Frequently Asked Questions
How much do I need to start a five-property plan?
Around $180,000-$220,000 of starting deposit equity, plus $30,000 of cash buffer. Below that, the first deposit consumes everything and there is no resilience for the inevitable surprises.
How long does it take?
Realistically 7-10 years if growth runs at 5-6% per annum. Faster only if you have rapidly growing income, or if you are doing manufactured-equity plays at every step. Slower if growth disappoints in any 2-3 year window.
Can I do this in a single state?
Yes, but you accept higher land tax exposure as the portfolio scales, and concentrated geographic risk. Most plans diversify across at least three states by the fifth property.
Do I need to use the same lender for every property?
No, and usually not. Spreading across multiple lenders avoids hitting any one lender's exposure cap. Different lenders also assess income differently — using the right lender for each step is the difference between approval and decline.
What happens if I get to four properties and stop?
Nothing bad. A four-property portfolio at 5% growth on $3M of asset value still creates $150,000 per year of equity. The engine works at any number of properties. Five is not a magic figure — it is the typical point at which serviceability and cash flow constraints meet income capacity for a $150,000-$200,000 earner.
Presm
Property investment insights from the Presm research team.
Want to put these insights into action?
Presm gives you the tools to model, track, and grow your property portfolio with confidence.