Why Perth Suburbs Are Outperforming Sydney in 2026 (and Why It Will Not Last)
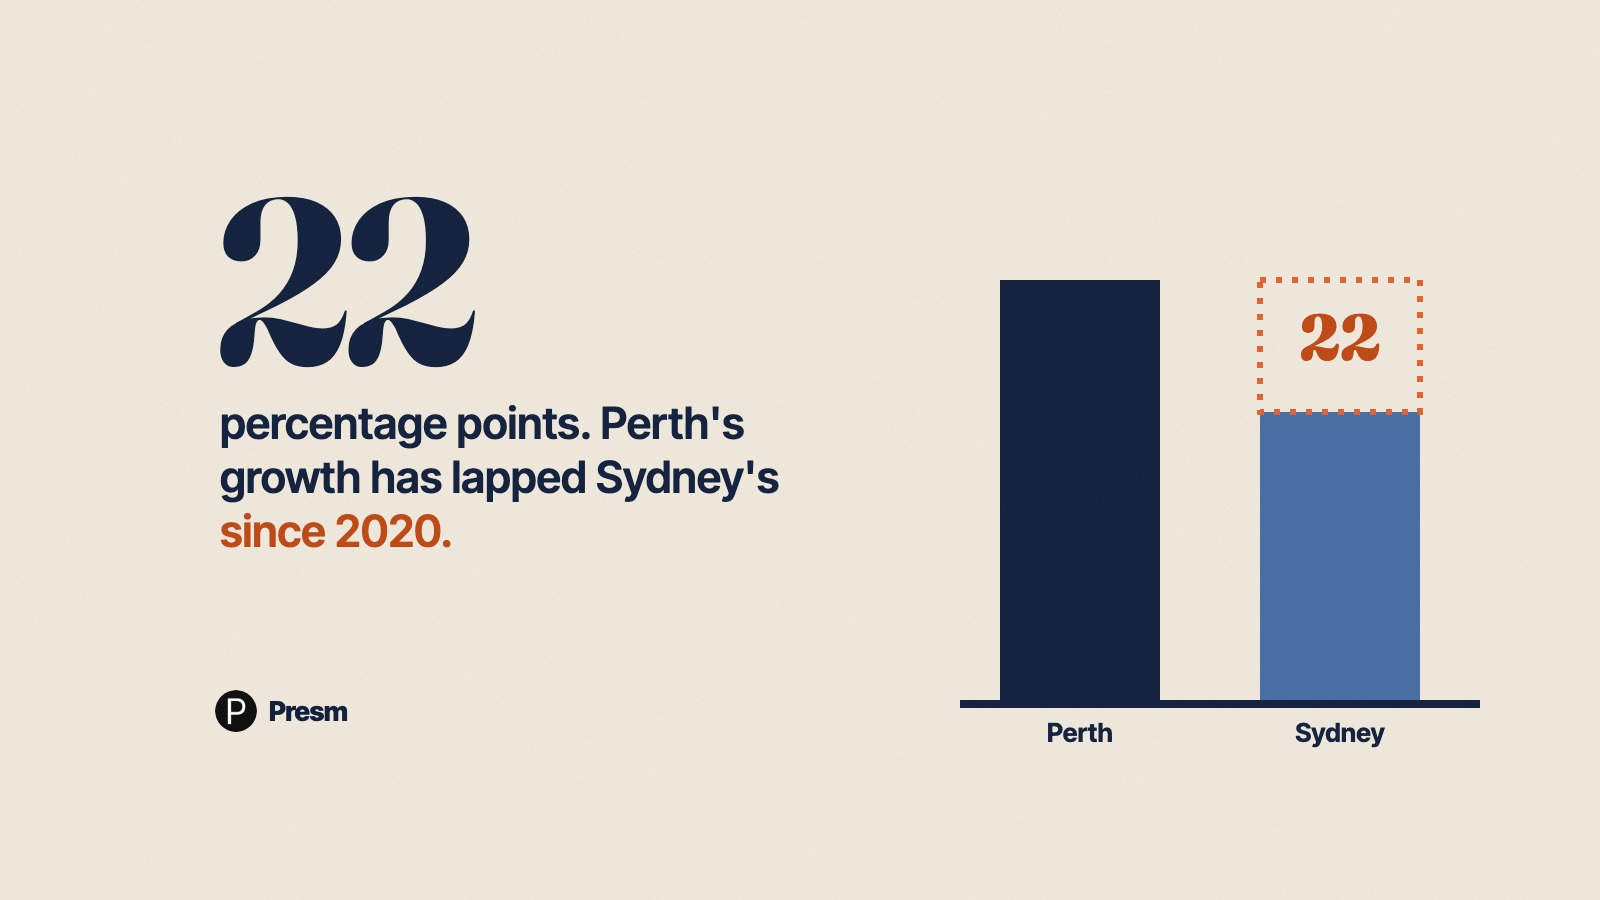
Perth has outpaced Sydney by 22 percentage points of capital growth since 2020 — Perth +70% versus Sydney +48%. Five years ago that comparison would have been laughable. Sydney was the structural champion of Australian residential property; Perth was the volatile commodity-driven market that nobody serious built a portfolio around.
The reversal is not just a cycle quirk. It reflects genuine structural shifts in migration, employment, and housing supply that have made Perth the better short- and medium-term play. It also reflects cycle dynamics that historically end badly for Perth.
The trade has 12-24 more months of momentum on current data. Beyond that, the Sydney structural advantages — depth, diversification, scale — reassert themselves.
The Five-Year Scoreboard
| Metric (early 2020 → early 2026) | Perth | Sydney |
|---|---|---|
| Median house price | $445,000 → $760,000 | $960,000 → $1,420,000 |
| Capital growth | +70.8% | +47.9% |
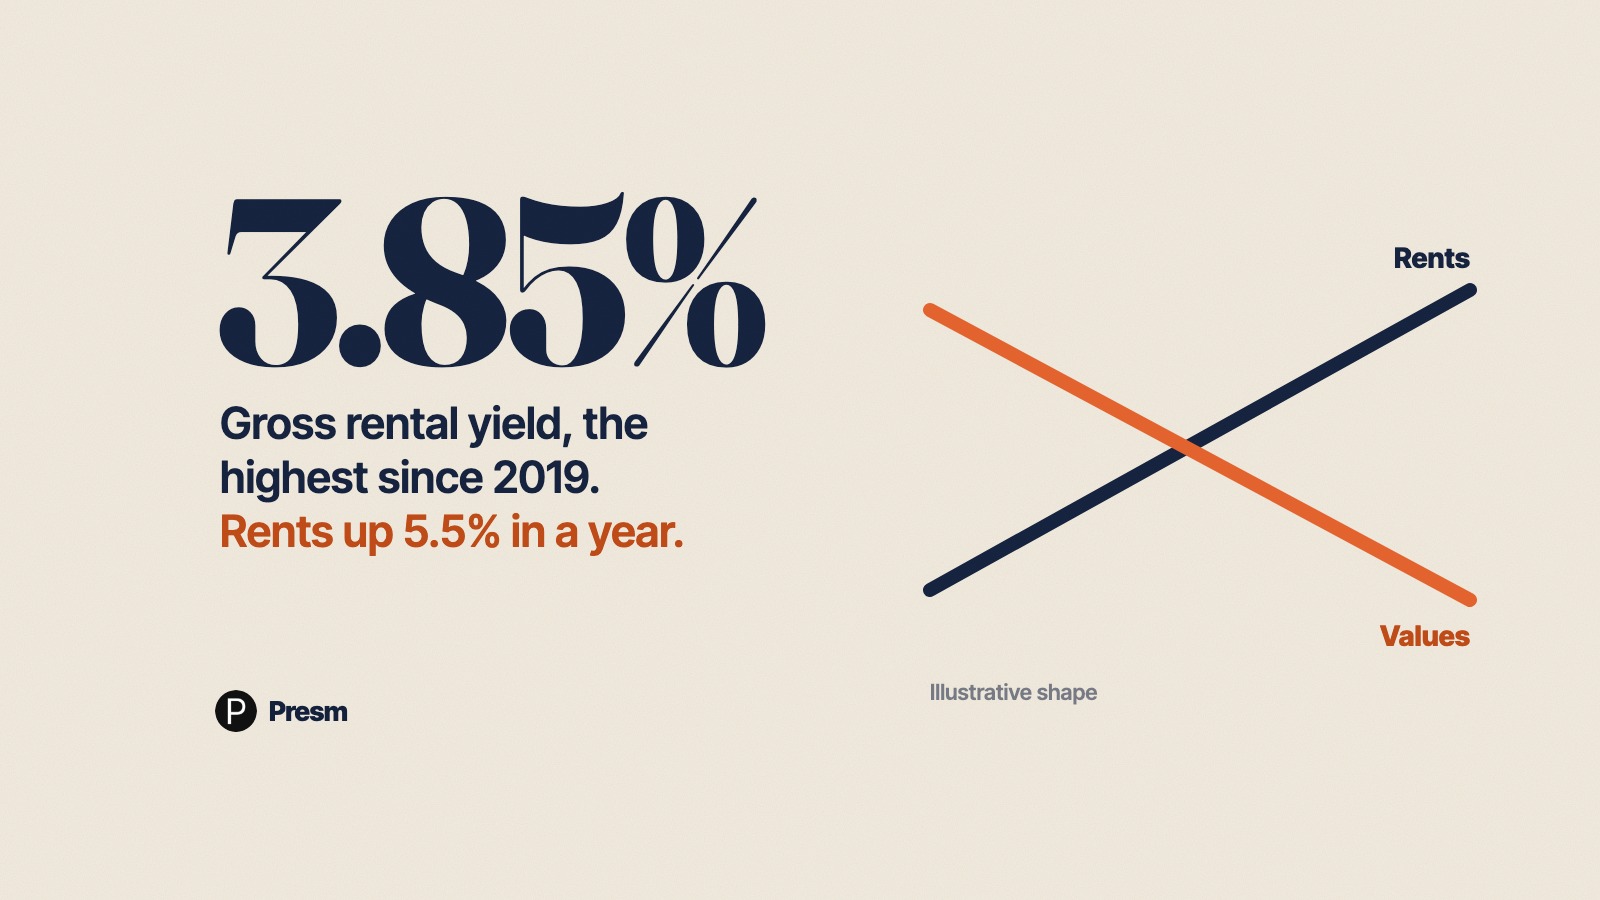
| Median rent (house) | $390/wk → $720/wk | $580/wk → $830/wk |
| Rent growth | +84.6% | +43.1% |
| Vacancy rate (early 2026) | 0.4% | 1.4% |
| Net interstate migration (2025) | +18,000 | -28,000 |
| Net overseas migration (state) | +52,000 | +145,000 |
- Median house price
- $445,000 → $760,000
- Capital growth
- +70.8%
- Median rent (house)
- $390/wk → $720/wk
- Rent growth
- +84.6%
- Vacancy rate (early 2026)
- 0.4%
- Net interstate migration (2025)
- +18,000
- Net overseas migration (state)
- +52,000
- Median house price
- $960,000 → $1,420,000
- Capital growth
- +47.9%
- Median rent (house)
- $580/wk → $830/wk
- Rent growth
- +43.1%
- Vacancy rate (early 2026)
- 1.4%
- Net interstate migration (2025)
- -28,000
- Net overseas migration (state)
- +145,000
The migration numbers tell the story. Sydney has been losing residents to QLD, WA, and Victoria for 5 years running, while Perth has been winning the interstate flow.
Why Perth Is Outperforming
Driver 1: Genuine housing under-supply. WA built fewer homes per capita than any other state across 2018-2024. The construction industry was decimated by the 2014-2019 mining downturn and never rebuilt scale. Approval volumes only restarted in 2023; settlements are still 2-3 years behind demand.
Driver 2: Resource sector employment. Iron ore at $US 95-105/tonne keeps the major producers (BHP, Rio, Fortescue) profitable and hiring.
Driver 3: Internal migration from East Coast. Sydney and Melbourne households moving to Perth for affordability, with the median Perth house at 53% of the median Sydney house.
Driver 4: Government stimulus and grants. Various WA state government incentives for first-home buyers and key workers added marginal demand.
Driver 5: Limited apartment supply. Unlike Sydney and Melbourne, Perth's apartment construction has been minimal during the cycle.
Why Sydney Is Underperforming Comparatively
Drag 1: Affordability ceiling. Sydney's median house price of $1,420,000 has reached a level where typical PAYG incomes cannot service typical purchases.
Drag 2: Out-migration of mid-income households. Households earning $130,000-$200,000 — the heart of investor demand — have been relocating to QLD and WA at unprecedented rates.
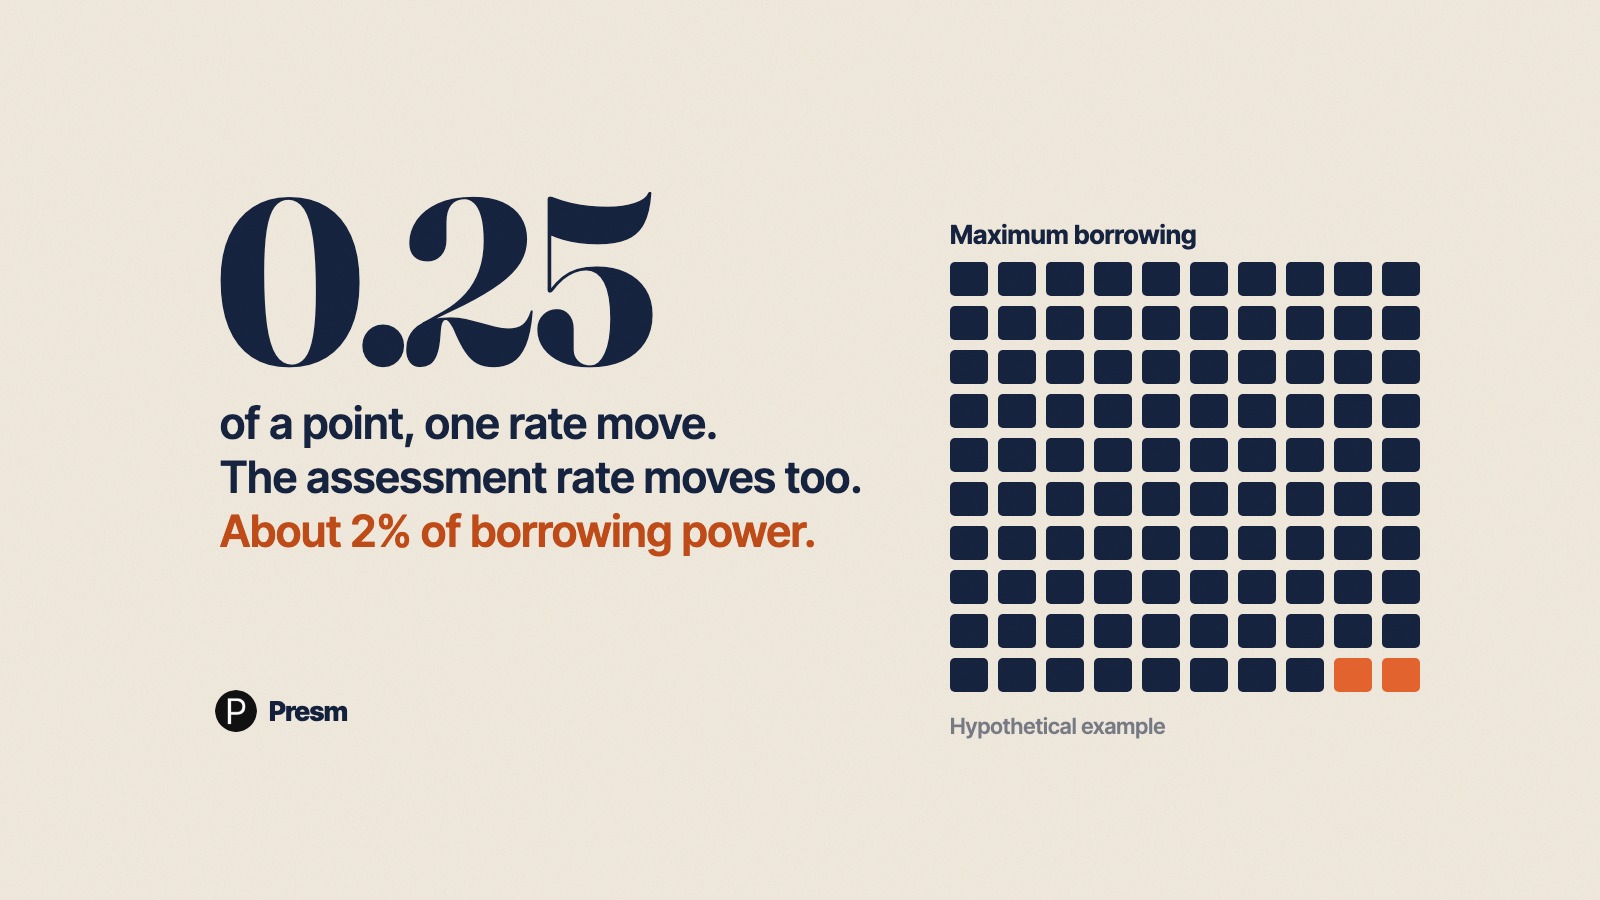
Drag 3: APRA buffer at 3% above rate. The serviceability buffer hits Sydney harder than Perth in absolute terms because Sydney loans are larger.
Drag 4: Investor lending caps. Some major lenders have applied stricter exposure limits to Sydney investor lending given concentrated risk in the city's market.
What Sydney Still Has
The structural Sydney advantages have not disappeared:
Advantage 1: Job depth and diversification. Sydney's economy is broader than Perth's — financial services, technology, professional services, healthcare, advanced manufacturing.
Advantage 2: International desirability. Premium Sydney suburbs attract sustained inbound interest from international and offshore-Australian capital.
Advantage 3: Inner-city scarcity. Sydney's inner-ring suburbs (Paddington 2021, Surry Hills 2010, Bondi 2026) cannot be replicated. Long-run capital growth in these markets has been the strongest in Australian history.
Advantage 4: Liquidity. Sydney's transaction depth means properties sell faster, with smaller selling discounts, in any market condition. Perth's market is shallower and exit costs in downturns can be material.
What 2026 Likely Looks Like
A reasonable base case for the comparison through 2026:
| Market | 2026 expected growth | Direction |
|---|---|---|
| Perth metro | +6 to +9% | Continued strong run, peaking |
| Sydney metro | +4 to +6% | Steady, with rate cuts adding mid-year |
| Spread | Perth still outperforms by 2-3% | Last year of meaningful Perth lead |
- Perth metro
- +6 to +9%
- Sydney metro
- +4 to +6%
- Perth metro
- Continued strong run, peaking
- Sydney metro
- Steady, with rate cuts adding mid-year
- Spread
- Last year of meaningful Perth lead
The Perth lead narrows because:
- Perth's growth slows from 18-22% per annum in 2024-2025 to 6-9% as the cycle matures
- Sydney accelerates from 4% per annum in 2025 to 5-6% as rate cuts arrive
- Construction supply in Perth begins to absorb demand by late 2026
By 2027-2028, the comparison likely flips. Perth's cycle exits or stalls; Sydney resumes its long-run pattern of 4-7% per annum growth. Investors holding Perth into the post-cycle period eat the 10-15% peak-to-trough drawdown that has historically followed Perth peaks.
What This Means For Your Next Purchase
Action 1: Take Perth exposure now if not already held, but size it. The remaining cycle has 12-18 months of likely growth. Limit Perth exposure to no more than 35% of portfolio.
Action 2: Build long-term Sydney exposure if portfolio scale allows. Sydney's structural advantages mean the long-run compounding (15+ years) is still the strongest of any Australian capital. Inner middle-ring houses (Marrickville 2204, Strathfield 2135, Drummoyne 2047) remain strong long-run plays.
Action 3: Plan the Perth exit. Establish a trigger — typically iron ore price below $US 75/tonne sustained 6 months, or vacancy rises above 1.5%, or three consecutive months of negative price movement. When the trigger fires, sell or rebalance.
Action 4: Diversify the portfolio across cycles, not just states. Brisbane's 2026-2032 setup, Perth's late-cycle remaining run, Sydney's structural long-run growth, and selective regional yield. The mix beats single-market concentration in every scenario.
Run the Borrowing Power Calculator to confirm what each candidate market price point requires. Use the Stamp Duty Calculator to compare acquisition costs across states.
For Brisbane-specific 2026 picks, see our top Brisbane suburbs guide. For broader Perth analysis, see our Perth investment opportunities.
Frequently Asked Questions
Has Perth peaked?
Probably not yet, but late-cycle. Vacancy at 0.4%, continuing migration, and supply still 2-3 years behind demand suggest 12-18 months of remaining strong growth. The peak typically arrives 4-6 years into a cycle; Perth is now at year 6.
Is Sydney still worth buying in 2026?
Yes, with realistic expectations. Sydney's growth in 2026 will be 4-6%, lower than Perth's 6-9% but more durable. For 15+ year horizons, Sydney's structural growth has historically been the strongest.
Should I sell Sydney to buy Perth?
Generally no. Selling Sydney triggers CGT (potentially $200,000+), stamp duty on the new Perth purchase, agent commission, and exit costs. The growth differential needs to be very large to justify these frictions. Refinancing Sydney equity to fund a Perth purchase makes more sense than selling.
How does Brisbane compare to both?
Brisbane sits in the middle. Smaller cycle to date than Perth, larger structural catalyst than Sydney (Olympics, Cross River Rail). For a one-market pick in 2026, Brisbane has the best risk-adjusted forward setup.
What signals would tell me Perth is peaking?
Three signals to watch: (1) iron ore price sustained below $US 80/tonne for 6+ months, (2) vacancy rate rising above 1.5% from the current 0.4%, (3) rent growth slowing below 5% per annum. When two of three appear, the cycle has likely peaked.
Presm
Property investment insights from the Presm research team.
Want to put these insights into action?
Presm gives you the tools to model, track, and grow your property portfolio with confidence.