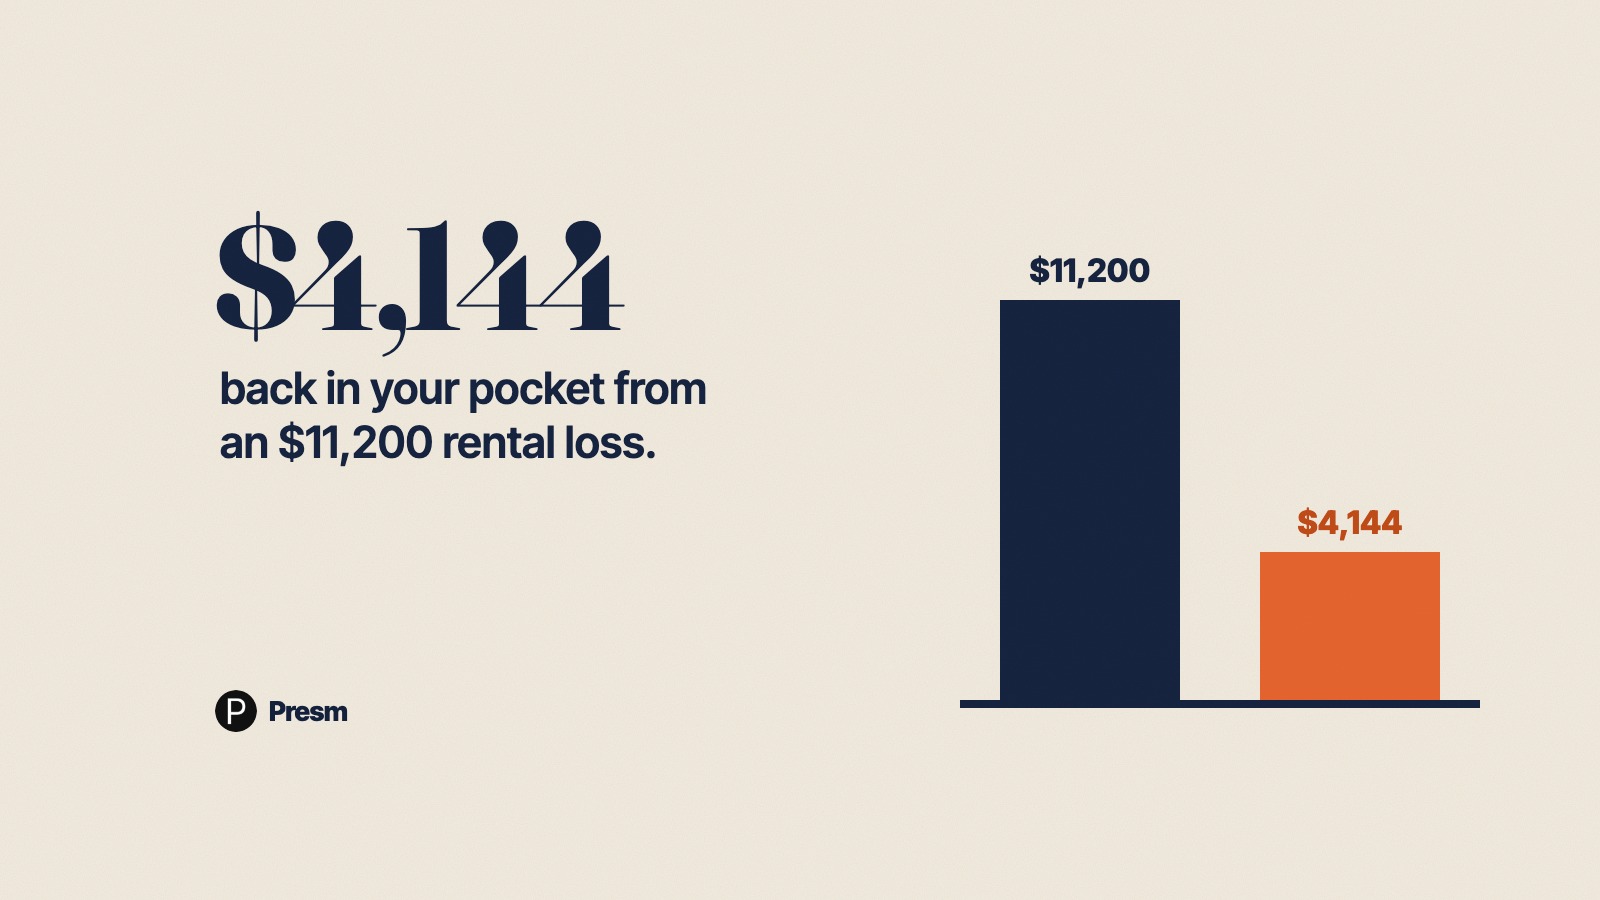
Negative Gearing in 2026: How $11,200 of Rental Loss Becomes $4,144 in Your Pocket
Most investors think the tax refund is the strategy. It is not. The refund is the side effect of a property that bleeds cash every month, and treating it as the goal is how people end up four years deep into a portfolio they cannot afford to hold.
Negative gearing only makes sense when the capital growth pays for the holding cost, when the marginal tax rate is high enough to make the deduction worth claiming, and when serviceability still has headroom for the next purchase. Pull any one of those three legs and the strategy falls over.
This post walks the actual maths at the FY 2025-26 Stage 3 marginal rates on a real $750,000 investment property in Bulimba (4171), held by an individual on a $145,000 PAYG salary. Then it shows where the same strategy quietly destroys investors who do not pay attention to the second-order effects.
What Negative Gearing Actually Is in Australian Tax Law
A property is negatively geared when its deductible holding costs exceed its assessable rental income. The shortfall reduces your other taxable income — usually your salary — under section 8-1 of ITAA 1997, which is the general deductions provision.
Section 8-1 has two limbs. The first allows you to deduct losses or outgoings to the extent they are incurred in gaining or producing assessable income. The second covers losses or outgoings necessarily incurred in carrying on a business for that purpose. For most rental property investors, you are claiming under the first limb.
The Commissioner does not refund you the loss itself. The Commissioner refunds you the marginal tax rate applied to that loss. That distinction is everything. If you are on the 30% bracket, a $10,000 rental loss returns $3,000 of tax. You are still $7,000 out of pocket on a cash basis.
Investors who confuse "the refund" with "the saving" routinely buy properties that destroy their wealth. The refund is the multiplier on the loss. It does not turn a loss into a gain.
The FY 2025-26 Stage 3 Brackets That Drive Every Calculation
The Stage 3 cuts came in on 1 July 2024. The brackets that apply to your 2025-26 return:
| Taxable income | Marginal rate |
|---|---|
| $0 – $18,200 | 0% |
| $18,201 – $45,000 | 16% |
| $45,001 – $135,000 | 30% |
| $135,001 – $190,000 | 37% |
| $190,001 and above | 45% |
Add the 2% Medicare levy on top for most residents. The headline marginal rate at $145,000 of income is 30% + 2% = 32%.
That 32% is the multiplier on every dollar of deductible rental loss, but only up to $135,000 of taxable income. Above that, the marginal rate jumps to 37% (39% with Medicare).
This stepped structure means your refund on a $30,000 loss is not a flat $9,600. It is calculated band-by-band as the loss reduces your taxable income across multiple brackets.
Worked Example: $750,000 Bulimba Purchase, 80% LVR, Year One
A 36-year-old senior analyst on a $145,000 base PAYG salary buys a 4-bedroom, 2-bathroom, 2-car house in Bulimba (4171) for $750,000. She puts $150,000 deposit down, borrows $600,000 IO at 6.20%, and signs a 12-month lease at $620 per week with a Brisbane property manager.
The cash position
| Line | Amount |
|---|---|
| Gross rent ($620 × 52) | $32,240 |
| Vacancy allowance (3 weeks per annum, conservative) | -$1,860 |
| Property management fee (7.7% incl. GST) | -$2,343 |
| Letting fee (annualised, ~1.5 weeks every 18 months) | -$520 |
| Council rates (Brisbane City Council) | -$2,400 |
| Water access charges (utility component, owner pays) | -$1,200 |
| Building insurance (landlord protection included) | -$1,650 |
| Repairs and maintenance (year-one allowance) | -$2,000 |
| Body corporate fees | $0 (freestanding house) |
| Loan interest ($600,000 × 6.20%) | -$37,200 |
| Borrowing cost amortisation (1/5 of $4,200, Section 25-25) | -$840 |
| Cash result before tax | -$17,773 |
The property loses $17,773 a year before tax — or $342 a week. That is real money out of her pocket every fortnight.
The depreciation overlay
The 2018-built apartment qualifies for Division 43 capital works at 2.5% per year over 40 years. A QS-prepared schedule estimates the building cost at $300,000, generating $7,500 of annual Division 43 deduction.
For Division 40 (plant and equipment), the 2017 changes (section 40-27 ITAA 1997) restrict residential investors to assets they personally install. Existing dishwashers, carpets, and air conditioners that came with the property generate zero deduction.
She installs a new dishwasher ($1,400), a new ducted air conditioner ($4,800), and new ceiling fans ($800) in the first month. Year-one Division 40 deduction (using diminishing value method): approximately $1,750.
Total non-cash deductions: $7,500 + $1,750 = $9,250.
The full tax-side calculation
| Tax-side calculation | Amount |
|---|---|
| Gross rent (after vacancy) | $30,380 |
| Less: cash deductions | -$48,153 |
| Less: depreciation (non-cash) | -$9,250 |
| Total deductible loss | -$27,023 |
That $27,023 reduces her taxable income from $145,000 to $117,977.
How the refund stacks band-by-band
At $145,000, every dollar between $135,000 and $145,000 sits in the 37% bracket (39% with Medicare). Every dollar between $117,977 and $135,000 is taxed at 30% (32% with Medicare). The refund is not a flat percentage — it is the sum of tax saved in each band.
| Income band | Loss applied | Marginal rate (incl. Medicare) | Tax saved |
|---|---|---|---|
| $135,001 to $145,000 | $10,000 | 39% | $3,900 |
| $117,978 to $135,000 | $17,023 | 32% | $5,447 |
| Total tax refund | $9,347 |
- $135,001 to $145,000
- $10,000
- $117,978 to $135,000
- $17,023
- Total tax refund
- —
- $135,001 to $145,000
- 39%
- $117,978 to $135,000
- 32%
- Total tax refund
- —
- $135,001 to $145,000
- $3,900
- $117,978 to $135,000
- $5,447
- Total tax refund
- $9,347
Cash out: -$17,773. Refund: $9,347. Net after-tax holding cost: -$8,426 per year, or -$162 per week.
That $162 a week is what she pays to hold an asset that, on a 5% capital growth assumption, increases in value by $37,500 in year one. The property generates a paper return of $37,500 - $8,426 = $29,074 net for year one, on a $173,245 cash investment (deposit + duty + costs).
That's a 16.8% return on cash deployed in year one alone — purely from the leverage, the deduction blend, and a modest growth assumption.
State-by-State Comparison: Where the Same $30,000 Loss Lands Differently
The same $30,000 negative gearing loss produces dramatically different refunds depending on what state your property sits in (because of land tax interaction) and what your taxable income is (because of marginal rate stacking).
Same investor, same $30,000 loss, different income brackets:
| Taxable income | Bracket entry | Refund on $30,000 loss |
|---|---|---|
| $80,000 | 30%/32% | $9,600 |
| $145,000 | 30/37%/blended | $9,347 |
| $200,000 | 45%/47% | $13,830 |
- $80,000
- 30%/32%
- $145,000
- 30/37%/blended
- $80,000
- $9,600
- $145,000
- $9,347
- $200,000
- $13,830
The 45% bracket investor extracts $4,200 more tax saving from the same loss. This is why high-income earners are structurally better suited to negative gearing strategies — the refund per dollar of loss is materially higher.
But high-income earners also face higher serviceability scrutiny, and the rental loss add-back rules in lender models can cost them more borrowing capacity than they save in tax.
Where Negative Gearing Quietly Destroys Investors
The strategy fails in three specific ways, and each one costs more than the tax refund.
Failure mode 1: No capital growth
A unit in Melbourne CBD (3000) bought in 2017 for $580,000 is worth roughly the same in 2026. Same investor, same $9,000 a year of after-tax money to hold, multiplied by 9 years = $81,000 down with nothing to show for it.
The deduction was real every year. The refund was real every year. The asset just didn't move. Negative gearing on a flat asset is a slow bleed — the refund is the marginal rate applied to a loss that would not exist without the asset.
If you cannot defend a 5%+ growth thesis on the specific suburb and stock type, do not run this strategy. The maths only works when the growth pays for the holding cost.
Failure mode 2: Income drops through the bracket
A specialist on $200,000 buys with the assumption of 45% bracket refunds. She loses her senior role and moves to a $130,000 contract. The same $30,000 loss now refunds at 30%/32% instead of 45%/47% — the refund drops from $13,830 to $9,600.
Her after-tax holding cost on the same property jumps by $4,230 per year. Combined with reduced overall income, the property may no longer be sustainable.
The strategy is sensitive to your salary trajectory. A property bought at peak-career income is much harder to hold through a redundancy or career change than the spreadsheet suggests.
Failure mode 3: Interest rates rise faster than rents
When the cash rate moved from 0.10% to 4.35%, an investor on a $600,000 IO loan saw their interest cost climb from $13,200 to $37,200. Rents in most metro markets took 24 months to follow.
The cash loss tripled. The refund grew correspondingly. But the after-tax holding cost still doubled, because rents lagged behind interest by 18-24 months.
An investor with $50,000 of cash buffer rode through. An investor at zero buffer was forced to sell at the worst possible time — peak rates, frozen valuations.
The Lender Add-Back That Eats Your Borrowing Capacity
Most major lenders apply a "negative gearing add-back" to serviceability calculations. They add back the negative gearing benefit because they cannot assume rates will stay where they are.
A worked example: an investor with $30,000 of rental loss showing on her tax return.
- Her actual taxable income: $115,000 (after the loss).
- Bank's serviceability income: $145,000 (loss added back).
- BUT — bank's serviceability EXPENSES include the full notional loan repayment at the assessment rate (product rate + 3% APRA buffer).
So she gets credited with $30,000 more income but assessed at 9.20% instead of 6.20%, which adds roughly $9,000 of notional annual interest. The net serviceability impact is positive but materially smaller than the tax saving suggests.
Stack three or four negatively geared properties together and the assessment-rate repayments compound. Most multi-property investors hit a serviceability wall around the third or fourth property — covered in detail in our scaling property portfolios guide.
How to Actually Run This Strategy
Three rules separate investors who compound wealth from investors who fund the strategy with their lifestyle:
- Defend the growth thesis on every property. No specific reason this suburb will outperform — infrastructure, gentrification, supply constraint? Then don't buy it. Negative gearing makes speculation more expensive, not safer.
- Maintain at least 6 months of holding-cost buffer. Sudden rate moves and tenant gaps will happen. Investors who run zero-buffer plans get forced sales when a single bad year hits.
- Re-run the maths every July. Marginal rates, rates, and rents all change. The strategy that worked at $200,000 income and 5.50% rates may be very different at $145,000 income and 6.20%.
Run your specific scenario through the Loan Repayment Calculator at both current rates and 1.5% above. Then run the Borrowing Power Calculator to see how this purchase affects capacity for the next one.
For broader strategy framing covering when negative gearing is the right call versus alternatives, see our property investment strategy 2026 guide. For how the eventual sale interacts with all those years of deductions, see our reduce capital gains tax guide.
Frequently Asked Questions
Is negative gearing being abolished in 2026?
No. There has been no legislation introduced to remove or grandfather negative gearing. Section 8-1 of ITAA 1997 remains the basis for claiming rental losses against other income. Various election cycles have raised the prospect, but no legislative change has progressed to drafting.
How much do I need to earn for negative gearing to make sense?
Mathematically the deduction works at any income above the $18,200 nil-tax threshold, but the strategy only justifies the cash loss when your marginal rate is 30% or higher. That kicks in at $45,001 of taxable income for FY 2025-26. Below that, the refund per dollar of loss is too low to justify the cash drag.
Can I negatively gear through a discretionary trust?
You can hold the property in a discretionary trust, but rental losses inside the trust cannot be distributed — they are quarantined inside the trust until offset by future trust income. This is the trade-off versus holding in your personal name. Trusts make sense for long-term asset protection and estate planning, not for negative gearing.
Does depreciation reduce my CGT base when I sell?
Yes. Division 43 capital works deductions reduce your cost base under section 110-45 ITAA 1997. A $50,000 lifetime depreciation claim translates to a $50,000 increase in your assessable capital gain on disposal. Division 40 plant and equipment is treated separately as a balancing adjustment in the year of disposal.
What happens to the loss if I make a profit on the property next year?
Once rental income exceeds deductions, the property is positively geared and contributes to your taxable income. There is no carry-forward of prior-year rental losses for individuals — they are claimed against your other income in the year they are incurred. Trust losses behave differently and quarantine until the trust generates offsetting income.
Presm
Property investment insights from the Presm research team.
Want to put these insights into action?
Presm gives you the tools to model, track, and grow your property portfolio with confidence.